 Next
Next
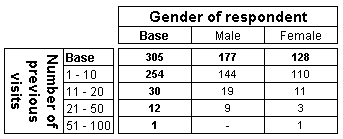
Sometimes you may want to group the values in a numeric variable into categories. The process of creating categories from a numeric variable is sometimes called banding and each category is called a band. For example, the numeric visits variable in the Museum survey stores the number of times respondents have visited the museum before. Responses can contain any value from 1 to 100. To display this information on a table, you can specify a number of bands, and display one row or column for all responses that fall into each band. This table shows the responses in the visits variable grouped into four bands:

You can use the Insert Bands dialog box to create automatic bands (for example, ten equal bands starting at the minimum value and ending at the maximum value) or you can define the bands individually.
► In the Variables pane, select the numeric variable for which you want to create the bands.
From the menu, choose:
This opens the Insert Bands dialog box, with the Edit Variable dialog behind it.
► In the Insert Bands dialog box, choose the Get values from data button. The minimum and maximum values from the saved data are displayed in the From and To text boxes.
► Choose OK.
► In the Insert Bands dialog box, enter the starting value for the first band in the From text box.
► Enter the ending value for the final band in the To text box.
► Enter the number of bands to create in the Number of bands text box.
► If the variable contains responses that use decimals, you can use the Number of decimals text box to set the number of decimal places to use for the bands.
► Choose OK to close the dialog box, then choose the Save button in the Edit Variable dialog box to save your changes.
► In the Insert Bands dialog box, enter the starting and ending value for the first band in the From and To text boxes.
► Set the Number of bands to 1.
► If it is a real numeric variable, enter the Number of decimals.
► Choose OK.
► Repeat as necessary for each band you want to create.
► Choose Save and Close from the toolbar.