 Next
Next
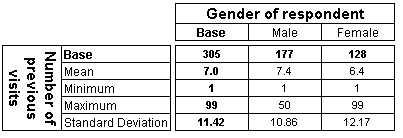
Sometimes you may want to show a summary statistic of the values in a numeric variable (such as the mean, minimum, or maximum) rather than grouping the values into bands. For example, the visits variable in the Museum sample data set is a numeric variable that stores the number of times respondents have visited the museum before. You can show a summary of the values in the variable, as shown in the following table:

Note: IBM® SPSS® Data Collection Survey Reporter does not automatically add summary statistics to numeric variables that do not have any bands or other statistics defined. You will need to manually set up these definitions if they do not already exist. The Unable to Add Variable dialog displays in cases where variables do not have statistics defined. In practice you might want to mix both approaches, to include bands and also a mean value. In that case you could create bands, as shown in Creating bands, then insert the statistics as described below.
► In the Variables pane, select the numeric variable.
From the menu, choose:
This opens the Edit Variable window with the Insert Bands dialog box on top.
► Choose Cancel to close the Insert Bands dialog box.
► From the menu, choose
This opens the Insert Categories dialog box.
► In the list of Available Items, select the summary statistics you want to use. For example, select Minimum, Maximum, Mean, and Standard Deviation.
► Choose the >> button to add them to the Items to insert list.
► If required, edit the default description and decimal places for each inserted item.
► Choose OK to close the Insert Categories dialog box.
This inserts the statistics into the list on the Edit Variable window. By default, the statistics are based on the variable to which you are adding the categories.
► Choose Save and Close from the toolbar.