 Next
Next
You can change the content of individual rows and columns in the table, for example, to remove categories or create new categories based on existing ones. In this topic we will start with a table containing the age and gender variables, edit the category descriptions for the gender variable, then reduce the number of rows in the age variable by combining the existing categories into three new ones.
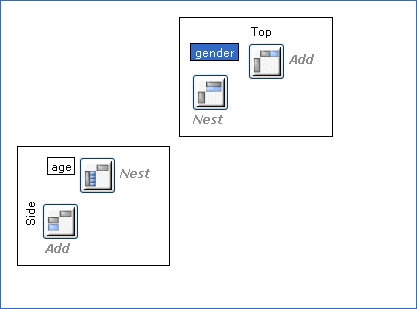
► First of all, create a new table and add age to the side and gender to the top, as shown in the Creating Crosstabulations topic.
► On the Design pane, select the gender variable.

► From the menu, choose:
Tip: You could also double-click the variable on the Design pane (not the Variables pane).
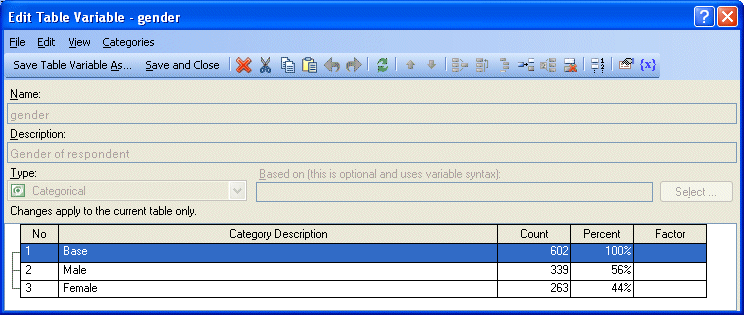
The Edit Table Variable window appears, with details of all the categories that appear on the table for the selected variable. Because you are editing the variable on the table, the changes you make apply only to that table and will not affect any other tables that use the variable (if you wanted the changes to apply to all tables, you would select the variable in the Variables pane, not in the Design pane).

► Double-click Male in the Category description column to select the text.
► Change the text to say Men, then press Enter to apply the change.
► In the same way, select the Female category description and change it to Women.
► Choose the Save and Close button to save your changes and close the Edit Table Variable window.
► On the Design pane, double-click the age variable.
► In the Edit Table Variable window, use Shift+click to select the 11-16 years, 17-20 years, and 21-24 years categories.
► From the Variables toolbar, choose
The three categories are combined into a single category with an automatically generated description.
► Change the description in the same way as for the gender variable, but this time, enter Young as the description.
► In the same way, combine the 25-34 years, 35-44 years, and 45-54 years categories, giving the new combined category a description of Middle.
► In the same way, combine the 55-64 years and 65+ years categories, giving the new combined category a description of Old.
The categories should now look like this:

► Choose the Save and Close button.
► Replace the default description Table4 with Age (banded) by gender.
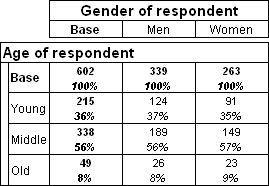
► Press F5 to update the results. The table appears as follows:

Each of the new categories contains the total number of respondents from the original categories that were combined to make it.
► Finally, press Ctrl+S to save the table in the table document.