 Next
Next
You can apply filters to your data, so that only those cases meeting certain conditions are included in the results. In this example, we will make a copy of the table of age by gender, and filter out all respondents of 16 years of age and under; that is, those who selected the 11-16 years category in the survey question: "To which age group do you belong?"
► In the Tables pane, select the table you created in Creating Crosstabulations:

► From the menu, choose
then
Tip: You could also press Ctrl+C followed by Ctrl+V.
A new table called Copy of Age by gender is added to the Tables pane. The new table contains all the information from the original table, including the change to the cell contents.
► In the Design pane, change the table description to say Age by gender, filtered.
► Select the Filter pane:

► In the Filter description field, enter the text: Excludes 16 and under. This description will appear as a header in the Results pane.
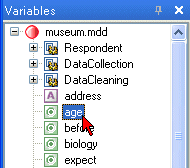
► In the Variables pane, select the age variable:

► Drag the variable onto the filter area (or you can use Ctrl+Alt+F):

The variable is added to the Filter pane. As this is a categorical variable, a list of the categories appears to the right of the category name. To the left is a drop-down list.
► Select Includes none of these from the list, then select the 11-16 years check box:

This is all you need to do to create the filter. It is automatically applied to the table when you click away from the Filter pane or generate the results.
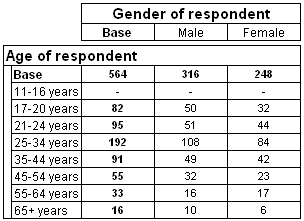
► To generate the results, press F5. This is the resulting table:

Notice that the 38 respondents aged 11-16 have been removed from the table, and that the original table base value of 602 has been reduced to 564.
► Finally, press Ctrl+S to save the new table in the table document.