 Next
Next
The p (probability) value is the basis for deciding whether or not there is a relationship between the data being tested. Generally you start with the null hypothesis, which is the assumption that there is no relationship between the data. If the p value is small enough (usually less than 0.05 or 0.01), you can reject the assumption of no relationship and conclude that there is a relationship.
A full list of the p values for each pair of columns tested in each row is available in the diagnostics information file for the table. See Diagnostics Information for further details. IBM® SPSS® Data Collection Survey Reporter reports p values as a decimal value with six decimal places (although trailing zeroes after the decimal symbol are not displayed by default when you open the file in Microsoft Excel). A reported p value of 0.05 is equal to a significance level of 5%. If the p value is smaller than the significance level you select for the test, the test statistic is significant.
The p value is also called the observed significance level.

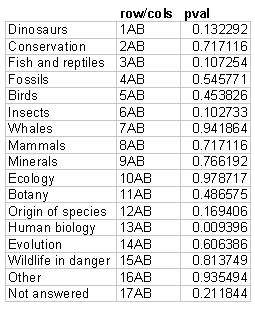
This example shows the p values for the first column proportions test example . It shows the row/cols and pval columns from the diagnostics data with the addition of the row labels. In the example, the column proportions test was run at the 5% significance level, and one row--Human biology--was found to be significant. Notice that the p value in this row is 0.009396. This is the only row with a p value of less than 0.05.
A full list of the p values for each pair of columns tested in each row is available in the diagnostics information file for the table. See Diagnostics Information for further details.
If you add a column proportions or column means test to a table, you can optionally display on the table a column showing the smallest p value found for any of the pairs of columns tested in each row of the test:
► From the menu, choose
► In the Statistics tab of the Table Properties dialog box, check the test Column proportions or Column means check box.
► Check the Show minimum p-value box.
This adds a new column with the name Minimum Pval to the table. Each row of this column displays the lowest p value found for any pair of columns tested in the row. If the table has more than two columns, the column IDs for the pair of columns that generated the lowest p value are also displayed.
Note: The minimum p value column is not valid, and so is not displayed, on a table with any nesting or concatenation on the top of the table.
If you have added a minimum p value column to a column proportions or column means test, you can sort the table on this column, so that the most significant rows appear at the beginning of the table:
► From the menu, choose
► In the Sort tab of the Table Properties dialog box, select the variablename{Minimum Pval} option from the Sort rows based on drop-down.
► Choose the ascending order option button.
If you have added a minimum p value column to a column proportions or column means test, you can hide rows based on the value in this column. This means that you can carry out a test on all the rows in the table and then hide any rows that contain no significant results, as determined by the minimum p value:
► From the menu, choose
► In the Hide tab of the Table Properties dialog box, check the Hide rows box.
► In the drop-down list, select greater than.
► In the numeric field to the right of the list, enter the significance level expressed as a percentage; for example, if you are using a significance level of 5, enter 0.05.
► In the based on drop-down list, select the variablename{MinPval} option.
Survey Reporter includes a menu option that enables you to apply all of the above changes to a table in a single step.
The Sort by Column Significance option carries out the following actions on the selected table(s):
• adds a column proportions and column means test to the table with the default significance level (5)
• adds a minimum p value column to the table
• sorts rows in ascending order by the minimum p value column
• hides rows where the minimum p value is greater than the significance level (greater than 0.05).
If required, you can change any of these settings (for example, if you want to remove the hide option or change the significance level) using the relevant tabs on the Table Properties dialog box.
See Sorting by Column Significance for further information.