 Next
Next
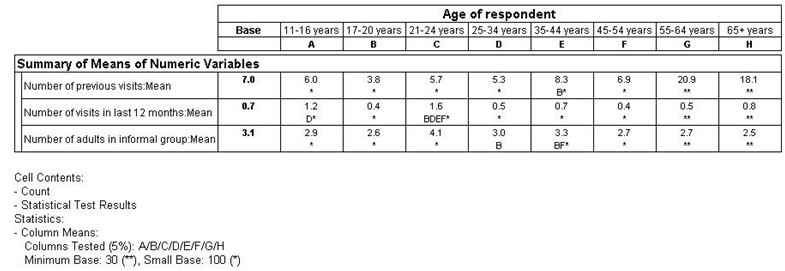
The column means test can only be run against the mean element. It will not work for the mean cell items in the summary statistic table. To run column means test against a range of variables, which can include both numeric and categorical variables, you need to use the Summary Means Table. The following shows a sample summary statistics table (based on visits, visits12, adults, and age).

You can see that the column means test is applied. This example displays a summary means table that provides the mean value for each variable by running the column means test using a mean element.
► In the Variables pane, select the variables that you want to summarize and select
from the menu, or press Alt+A, N, M.
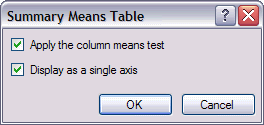
The Summary Means Table dialog displays, allowing you to choose if the column means test is applied to the table and, if all selected variables are numeric, if they can be displayed in a single axis variable.

► Select the appropriate options and click OK to close the dialog. A new table is created and the variables are added to the side of the table. If you selected Display as a single axis, a single variable, that contains a row for each selected variable, is created and added to the table.
► If you want to add any variables to the top of the table, select and add the variables using drag and drop or Ctrl+Alt+T.
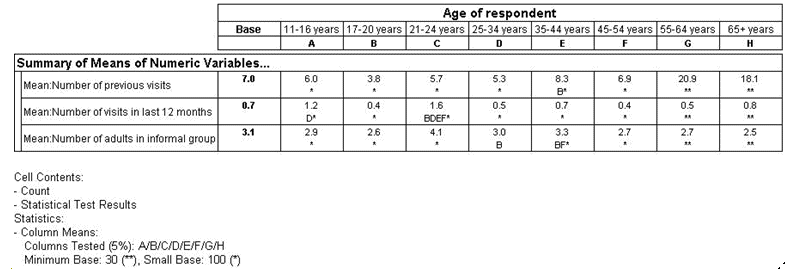
If all of the variables are numeric, you can choose to display them within a single variable by selecting the Display as a single axis option. IBM® SPSS® Data Collection Survey Reporter creates a new variable called SummaryVariable and adds it to the side of the table. SummaryVariable contains a single mean element row for each of the selected variables.

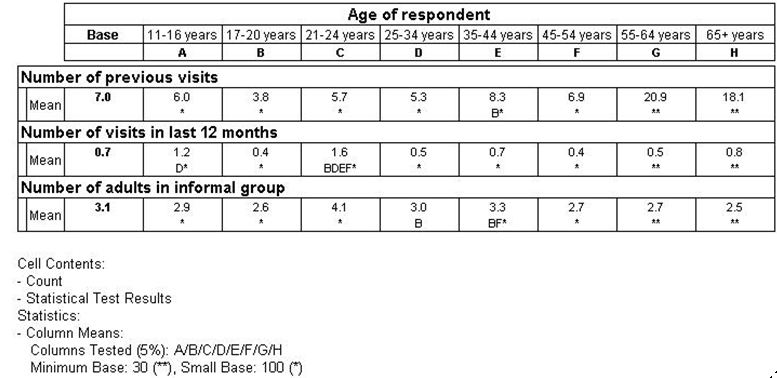
If you do not use the Display as a single axis option, Survey Reporter adds the selected variables to the side of the table and edits them so that they each display a single row.

If the variable contains a mean element in its axis expression, Survey Reporter will automatically use the setting of that mean element. However, in the Display as a single axis scenario, the label will be overridden with the variable label.