 Next
Next
You may find it useful to summarize a number of different numeric variables in a single table. You can create a summary table by selecting the numeric variables that you want to summarize and then using the Summary Statistics Table dialog box to select the statistics that you want to see.
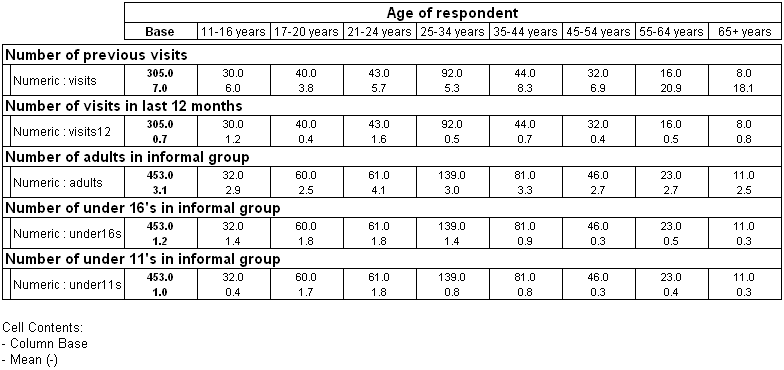
For example, the following table summarizes five questions (visits, visits12, adults, under16s, and under11s) that were asked in the original Museum survey, dealing with respondents' previous visits and the numbers of people of different ages in their group during the current visit. It shows the mean values for each of these questions, tabulated by age of respondent.

This example shows a summary table that provides the mean value for each variable by using a mean cell item. You can produce other types of summary statistic tables for any cell item that can be based on a numeric variable, for example, maximum, minimum, or standard deviation. For a full list, see the Summary Statistic Table dialog box.
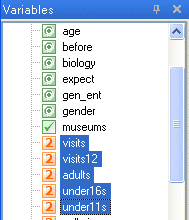
► In the Variables pane, select the variables that you want to summarize:

► From the menu, choose
► In the Summary Statistic Table dialog box, select the statistic(s) that you want to see for each variable. The default values are sum, minimum, maximum, and mean.
► The Summary Statistic Tables feature can only be applied on numeric variables. If you select a categorical variable, a error message will display. When creating the summary statistic table, you can also choose whether to summarize all the variables in a single new variable, instead of displaying each variable separately on the side of the table. Check the Display as single axis box.
► Choose OK to close the dialog box. A new table is created and the variables are added to the side of the table. If you selected Display as single axis, a single variable is created and added to the table, containing a row for each selected variable.
► If you want to add any variables to the top of the table, select and add the variables using drag and drop or Ctrl+Alt+T.
► Generate the table:
If you select the Display as single axis option, IBM® SPSS® Data Collection Survey Reporter creates a new variable called SummaryVariable and adds it to the side of the table. SummaryVariable contains a single row for each of the selected variables. The cell items correspond to the summary statistics that you selected.
If you include the base as one of the summary statistics, the base in all the rows is for all cases:

If you do not use the Display as single axis option, Survey Reporter adds the selected variables to the side of the table and edits them so that they each display a single row. The cell items in the row correspond to the statistics that you selected.
If you include the base as one of the summary statistics, the base in each row is the (non-null) cases for the variable in that row:
