 Next
Next
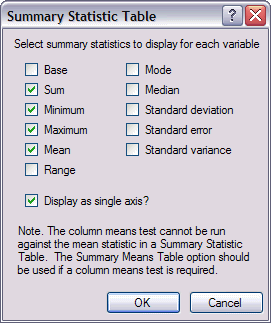
The Summary Statistic Table dialog box provides a quick way of creating tables of means or other statistics for a number of numeric variables.

To use the Summary Statistic Table dialog box, select the variables that you want to summarize in the Variables tab, then choose
from the menu, or press Alt+A, N, S.
Select summary statistics to display for each variable. These are the cell items that will be displayed for each variable. The default is the mean. Choose from any of the following cell items:
• base. The total number of cases that are eligible for inclusion in a variable, a row, a column, or a table. The base is used in statistical tests and for calculating percentages. Note that the base is that for the variable or variables displayed on the side of the table. If you select the Display as single axis option, the base in each row is the base for all cases. If you deselect this option, each variable is added separately to the side of the table, and the base in each row is for the variable summarized in that row.
• sum. The sum or total of the values.
• minimum. The smallest value.
• maximum. The largest value.
• mean. A measure of central tendency. It is the arithmetic average; the sum divided by the number of cases.
• range. The difference between the largest and smallest values--the maximum minus the minimum.
• mode. The most frequently occurring value. If several values share the greatest frequency of occurrence, each of them is a mode.
• median. The value above and below which half the cases fall; the 50th percentile. If there is an even number of cases, the median is the average of the two middle cases when they are sorted in ascending or descending order. The median is a measure of central tendency not sensitive to outlying values--unlike the mean, which can be affected by one or more extremely high or low values.
• standard deviation. A measure of dispersion around the mean. In a normal distribution, 68% of cases fall within one standard deviation of the mean and 95% of cases fall within two standard deviations. For example, if the mean age is 45 with a standard deviation of 10, then 95% of the cases would be between 25 and 65 in a normal distribution.
• standard error. A measure of how much the value of the mean may vary from sample to sample taken from the same distribution. The standard error of the sample mean can be used to estimate a mean value for the population as a whole. In a normal distribution, 95% of the values of the mean should lie in the range of plus and minus two times the standard error from the mean. Additionally, the standard error can be used to roughly compare the observed mean to a hypothesized value of another mean (that is, you can conclude the two values are different if the ratio of the difference to the standard error is less than -2 or greater than +2).
• sample variance. This is the sample variance, which is a measure of dispersion around the mean, equal to the sum of squared deviations from the mean divided by one less than the number of cases. The sample variance is measured in units that are the square of those of the variable itself.
Display as single axis? If you check this box, a new variable is created and added to the side of the table, containing a row for each selected variable. This option is available only for numeric variables. If you deselect this box, each variable is added separately to the side of the table.