 Next
Next
If you look at one of the tables created in the previous topics, you can see that each cell of the table contains two figures. These are the default cell contents, namely counts (the number of respondents that satisfy the row and column conditions for each cell) and column percentages. The cell contents for each table are listed in the table footer. You can change the cell contents for any table to show the information that you are interested in.
► In the Tables pane, select the table you created in Creating Crosstabulations:

► From the menu, choose
Tip: You can also press F4, or choose the Table Properties button on the toolbar:
The Table Properties dialog box appears, showing the Cell Contents tab. On the left of the tab is a list of all the types of cell contents that you can use in a table. On the right are the two default items, Counts and Column Percentages.
► Select Column Percentages in the Included in cells list on the right of the dialog box, and use the << button to remove it from the list of items.

► Choose OK to close the dialog box.
► The table is regenerated automatically to display the updated results (if the Results pane is not selected, select it or press F5 to generate the results).
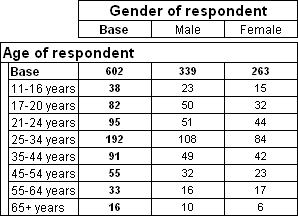
The table now contains only counts.

► Finally, press Ctrl+S to save the updated table in the table document.