 Next
Next
Sample Script File: NetDifferenceTest.mrs
This example script is based on the SkiDemo sample data set.
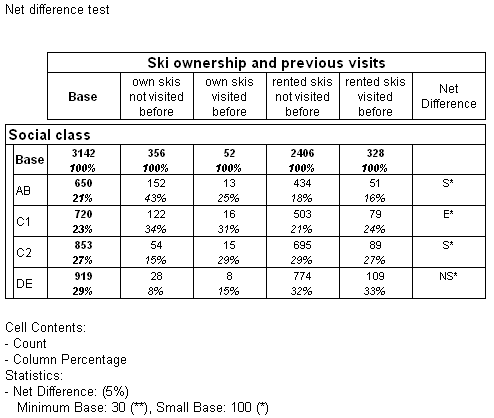
In this example, based on the SkiDemo survey installed with the IBM® SPSS® Data Collection Developer Library, a new variable that combines categories from the ownski and repeat variables forms the top of the table and the age variable forms the side.
Here is the resulting table:

The test is based on proportions; that is, it takes the value in each row as a proportion of the total for the whole column. For each row (socio-economic class in this example) it finds the difference for this value (the proportion of the whole column) between those who have not visited the resort before and those who have visited before. It does this separately for two groups of people, those who own their skis (the first and second columns) and those who rent them (the third and fourth columns). It then finds the overall difference between the two groups of people, ski owners and ski renters. This results in a single value for each row, which is then tested against the base for the column to see if it is significantly different from the column as a whole. If the result is found to be significant for any row, an S is placed in the net difference column for that row.
The net difference test in this example shows that there is a significant difference for the AB and the C2 socio-economic classes.