 Next
Next
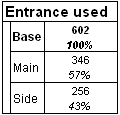
The formatting in the Results tab (and in files exported using the HTML Export option) is controlled by a style sheet. A number of style sheets are supplied with IBM® SPSS® Data Collection Survey Reporter. You can change the format of the Results tab by selecting a different style sheet from the drop-down list in the toolbar, or by choosing from the list in the Display tab of the Options dialog box. For example, here is a table formatted using the Black and White style sheet:

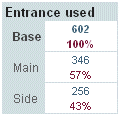
Here is the same table formatted using the Color Code style sheet:

The style sheet is actually a cascading style sheet (.css) file, which can be edited in a text or HTML editor, and which determines how each part of the output is formatted. In the first example above, the column percentage cell items are formatted in italics. This is controlled by the following section in the Black and White.css file:
TD.CellItemColPercent
{
   FONT-STYLE: italic;
}
TD.CellItemColPercent identifies the column percentages cell item, and the information in curly braces {} defines the formatting for that item, in this case by setting the FONT-STYLE property to italic.
In the Color Code style sheet column percentages are displayed in a shade of red, instead of in italics. Here is the equivalent section of the Color Code.css style sheet:
TD.CellItemColPercent
{
COLOR: #7C1E3F;
}
In this case, the Color property is set to #7C1E3F, which is simply a numerical value that corresponds to a specific shade of red.
You can modify the existing style sheets or create your own. You can also modify the style sheets used by the HTML Export option.