 Next
Next
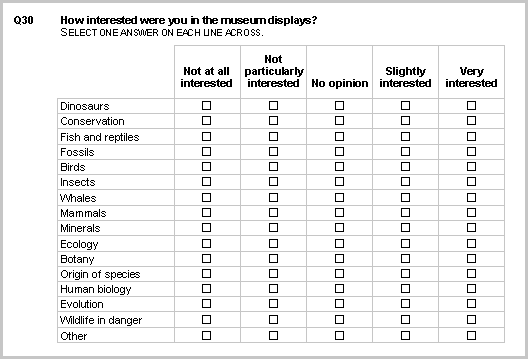
Surveys frequently include grid questions. These typically ask respondents to choose a rating on a predefined scale for a number of products in a list. For example, the Museum sample survey contains the following grid question (which is called rating):

It is generally easier to analyze data collected using a grid question as a grid table.
► From the menu, choose:
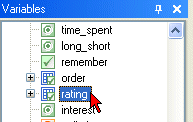
► In the Variables pane, select the grid variable you want to use:

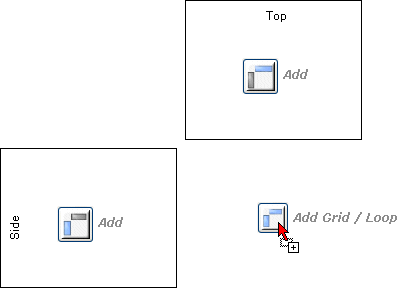
► Click and drag the variable to the Add Grid button on the Design pane:

The grid is added to the table.
► Generate the table:
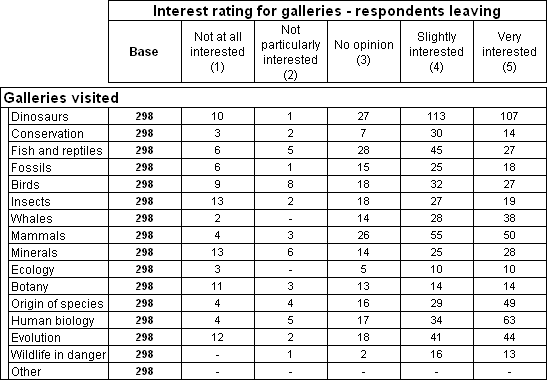
Here is the table for the Rating grid question:

By default, the orientation of the grid table is taken from the definition of the grid question in the metadata. However, you can override the default orientation if required by choosing the Transpose Table button:
You can create multiple grid tables at the same time.
► Use Shift+click or Ctrl+click in the Variables pane to select the grid variables.
► From the menu, choose
or simply drag all the selected grid variables to the Add Grid/Loop button.