
 Next
Next

Use the options in the Cell Contents tab to change the items in cells of your tables. For example, instead of displaying counts in each cell of a table, you may want to display only column percentages, or you may want to add a mean or standard deviation.
To display this tab, choose
from the menu and choose the Cell Contents tab.
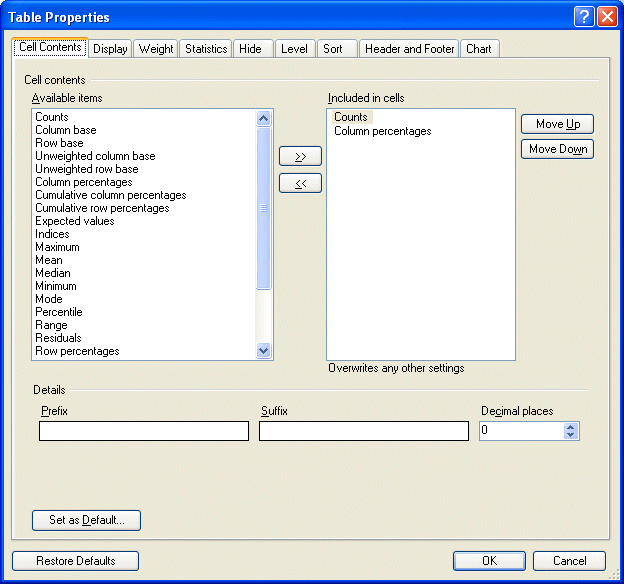
Available items. The following cell items are available. To add a cell item to the table, select it and choose the >> button to add it to the Included in cells list.
| Name | Purpose |
|---|---|
| Counts | Shows the number of cases that satisfy the row and column conditions for each cell. If the table is weighted, the counts are the weighted counts. |
| Column base | Shows the number of cases in the column base. This is shown in the base row of the table. This cell item is useful when the base row is hidden or when tables are so large that the row is not always visible. |
| Row base | Shows the number of cases in the row base. This is shown in the base column of the table. This cell item is useful when the base column is hidden or when tables are so large that the column is not always visible. |
| Unweighted column base | Shows the unweighted base for the column. This is shown in the base row of the table. This cell item is useful when the unweighted base row is hidden or when tables are so large that the row is not always visible. |
| Unweighted row base | Shows the unweighted base for the row. This is shown in the base column of the table. This cell item is useful when the unweighted base column is hidden or when tables are so large that the column is not always visible. |
| Column percentages | Expresses the count or sum of a numeric variable as a percentage of the base for the column. Expressing figures as percentages can make it easier to interpret and compare the data in a table. |
| Cumulative column percentages | Expresses the column percentages as cumulative percentages. |
| Cumulative row percentages | Expresses the row percentages as cumulative percentages. |
| Expected values | Shows the count or sum of a numeric variable that would be expected in the cell if the row and column variables are statistically independent or unrelated to each other. |
| Indices | Calculated for each cell by dividing the row percentage in the cell by the row percentage for the same column in the base row. Indices show how closely row percentages in a row reflect the row percentages in the base row. The nearer a row's indices are to 100%, the more closely that row mirrors the base row. |
| Maximum | This summary statistic of a numeric variable shows the largest value. |
| Mean | This summary statistic of a numeric variable gives a measure of central tendency. It is the arithmetic average--the sum divided by the number of cases who gave a response for the numeric variable. |
| Median | This summary statistic of a numeric variable shows the value above and below which half of the cases fall (the 50th percentile). If there is an even number of cases, the median is the average of the two middle cases when they are sorted in ascending or descending order. The median is a measure of central tendency not sensitive to outlying values (unlike the mean, which can be affected by one or more extremely high or low values). |
| Minimum | This summary statistic of a numeric variable shows the smallest value. |
| Mode | This summary statistic of a numeric variable shows the most frequently occurring value. When several values share the greatest frequency of occurrence, each of them is a mode. IBM® SPSS® Data Collection Base Professional displays only one mode in each cell--when there is more than one mode, Base Professional displays the first mode that it encounters in the data. |
| Percentile | This summary statistic of a numeric variable shows the value that divides cases according to values below which certain percentages fall. For example, the 25th percentile is the value below which 25% of cases fall. |
| Range | This summary statistic of a numeric variable shows the difference between the largest and smallest values--the maximum minus the minimum. |
| Residuals | Shows the difference between the count or sum of a numeric variable and the expected values. Large absolute values for the residuals indicate that the observed values are very different from the predicted values. |
| Row percentages | Expresses the count or sum of a numeric variable as a percentage of the base for the row. |
| Sample variance | This summary statistic of a numeric variable shows the sample variance, which is a measure of dispersion around the mean, equal to the sum of squared deviations from the mean divided by one less than the number of cases. The sample variance is measured in units that are the square of those of the variable itself. |
| Standard deviation | This summary statistic of a numeric variable shows a measure of dispersion around the mean. In a normal distribution, 68% of cases fall within one standard deviation of the mean and 95% of cases fall within two standard deviations. For example, if the mean age is 45 with a standard deviation of 10, then 95% of the cases would be between 25 and 65 in a normal distribution. |
| Standard error | This summary statistic of a numeric variable shows a measure of how much the value of the mean may vary from sample to sample taken from the same distribution. The standard error of the sample mean can be used to estimate a mean value for the population as a whole. In a normal distribution, 95% of the values of the mean should lie in the range of plus or minus two times the standard error from the mean. Additionally, the standard error can be used to roughly compare the observed mean to a hypothesized value of another mean (that is, you can conclude that the two values are different if there is no overlap in the values of the means plus or minus two times the standard error). |
| Sum | This summary statistic of a numeric variable shows the sum or total of the values. |
| Total percentages | Expresses the count or sum of a numeric variable as a percentage of the base for the table. |
| Unweighted counts | In a weighted table, these are the unweighted counts. In an unweighted table, the counts and the unweighted counts are identical. |
Included in cells. This lists the cell items that you have selected to appear on the table. By default, counts and column percents are selected. To remove a cell item from the table, select it and choose the << button.
Move up/Move down. Select an item in the Included in cells list and choose the Move up or Move down button to change the order in which cell items will be displayed in the table.
Prefix. You can add text, for example, a currency symbol, before the cell contents. Highlight the cell item in the Included in cells list, and type the text in the Prefix text box.
Suffix. You can add text after the contents of a cell, for example, a currency abbreviation. Highlight the cell item in the Included in cells list, and type the text in the Suffix text box.
Decimal places. Available for all types of cell contents. Specify the number of decimal places with which you want the values to be shown.
Based on. For summary statistics of a numeric variable, choose the numeric variable to use. For indices, residuals, expected values, and any of the percentage options, you can base the figures on counts or on the sums of a numeric variable if they have been specified for this table. The default is counts. If the table is weighted, these are the weighted counts. If you want to base the figures on the unweighted counts, you must remove the weighting from the table.
For mean, sample variance, standard error, standard deviation, minimum, maximum, range, sum, median, mode, and percentile, you can select a specific variable, or select the dash (-). Selecting a specific variable is suitable in cases where you want to show the mean for the same variable throughout the table. Selecting the dash tells IBM® SPSS® Data Collection Survey Reporter not to use a specific variable for the whole table, but instead to use the numeric variable specified in each category to calculate the mean for that category. This is useful if you want to create a summary statistic table where each category represents a different numeric variable. Note: You can set up summary statistic tables automatically using the Summary Statistic Table option on the Tables menu. See the topic Creating Summary Statistic or Summary Means tables for more information.
Percentile. Available for percentiles only, this enables you to specify the percentile required; for example, enter 25 for the 25th percentile.
Set as Default. Choose this button if you want the changes you make on this tab to be used as the default settings for all new tables that you create.
Restore to Defaults. Choose this button if you want the settings for all selected tables to revert to the default settings. This option restores the settings for all tabs in the Table Properties dialog box, not just the current tab.