 Next
Next
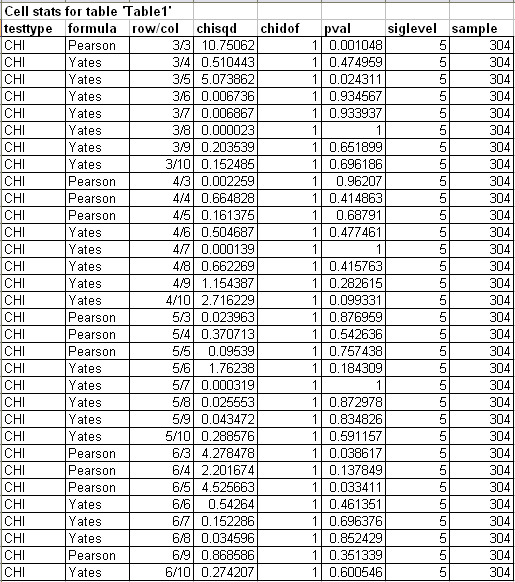
When you run a statistical test on a table, IBM® SPSS® Data Collection Survey Reporter can create diagnostics information that shows the p values and some of the intermediate figures used to calculate the statistics. The information is in comma-delimited format, so you can open it in Microsoft Excel and perform calculations on the data. The information varies according to the test. Here is the information for the :

The above example uses the Pearson test with the Yates' correction (when required).
Note that the diagnostic information for the cell chi-square test includes information for every table cell.
formula. Displays the name of the formula used.
rows/cols. These indicate the category row and column that the test was performed on.
chisqd. The chi-square value.
chidof. The degrees of freedom.
pval. The p value.
siglevel. The significance level.
sample. The sample size.