 Next
Next
The Creating tables using grid variables topic in the Using Variables section provides an introduction to grid tables and gives step-by-step instructions for creating a grid table. This topic provides more detailed information about grid tables and how they work.
You can create grid tables from any grid or loop that is defined in the metadata as expanded, regardless of whether the data was actually collected using a grid question in the questionnaire.
To see how grid tables work, look at the rating grid question in the Household sample. This grid question is nested inside the vehicle loop and so its full name is vehicle[..].rating (which we can optionally shorten to vehicle.rating). This grid question asks respondents to select a rating category for some of the vehicle's features.
Grid questions can be considered as categorical loops, which are loops in which a category list defines the iterations and the iterations are presented simultaneously in a grid-like format. The category list that defines the iterations is sometimes referred to as the controlling category list. One or more variables inside the loop define the question(s) to ask for each iteration. The rating grid contains one variable (called Column), which has a category list that defines the rating categories.
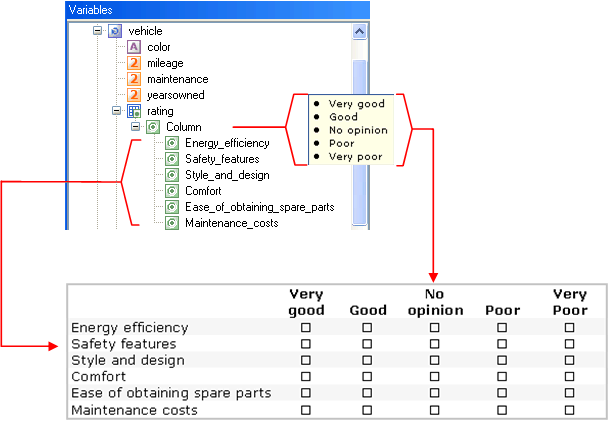
The following diagram shows how the grid in the Variables pane relates to the grid question when it is presented in a paper questionnaire.

In this example, each iteration of the grid forms a row of the grid question as it is presented in the paper questionnaire. The columns of the grid question are formed from the categories of the Column variable inside the grid. This variable's full name is vehicle[..].rating[..].Column.
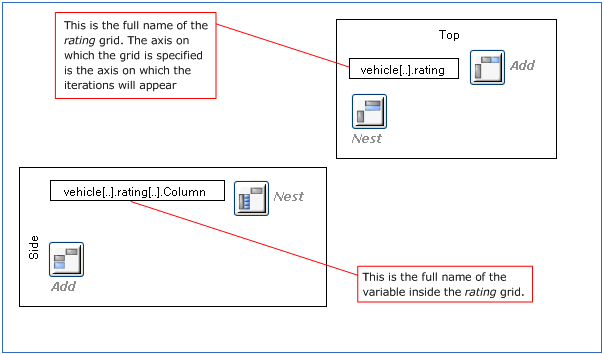
To create a grid table for the rating grid, select the grid in the Variables pane and choose the Add Grid/Loop button on the Design tab.
The variable name on the top of the table consists of the full name of the rating grid and the name on the side consists of the full name of the variable (Column) inside the grid.

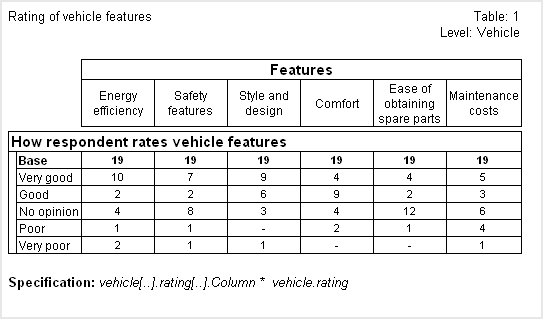
Here is the table:

When you create a grid table using the Add Grid/Loop button, IBM® SPSS® Data Collection Survey Reporter orients the grid table according to the default orientation defined for the grid or loop in the metadata. In this grid table, the iterations are displayed as columns because that is how the loop's default orientation is defined in the metadata.
If you do not want to use the default orientation, you can create the grid table using the opposite orientation, by choosing the Transpose button on the tool bar:
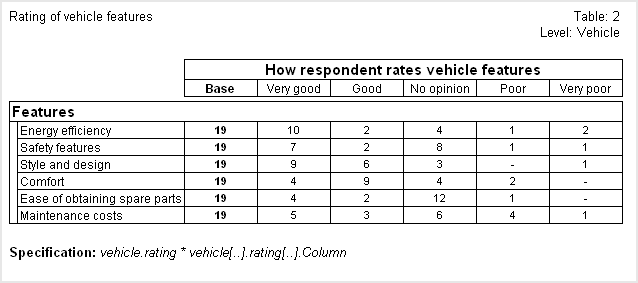
Here is the table, in which the iterations now form the rows:

The table specification has been added to the footers for these tables. This has the following form:
Side axis specification * Top axis specification
Notice that in the specifications for the two tables the top and side specifications are reversed.
The vehicle.rating grid contains only one variable--the Column variable. However, some loops contain more than one variable. When you use the Add Grid/Loop method with a grid or loop that contains more than one variable, all of the variables that are contained in the loop are concatenated together in the grid table. Any non-categorical variables that are inside the loop and do not have an axis specification defined are ignored.
For example, in the Household sample, the person loop is defined as expanded (which means that you can use it to create a grid table) and contains more than one variable, so you can use it in this way.