When you create a table using a variable other than a categorical variable (for example, a numeric or text variable) you need to create an axis expression for the variable. In the case of numeric variables, IBM® SPSS® Data Collection Survey Reporter automatically adds a default axis expression for any numeric variable that you add to a table using the Design pane. However, as the Table Syntax pane is an advanced feature, Survey Reporter makes no assumptions about what you want to include in the table definition, so you must enter a valid axis expression for the numeric variable.
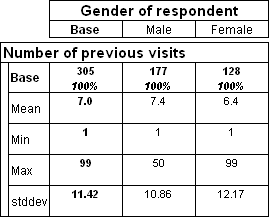
For example, you can create a table in the Design pane by dragging and dropping the visits variable onto the side of the table and the gender variable onto the top. This results in the following table:

However, if you try to create this table using the Table Syntax pane by typing:
visits * gender
an error is displayed when you choose the Apply button. This is because the visits variable is a numeric variable and so requires an axis expression. If you create the above table using the Design pane and look at what is displayed in the Table Syntax pane, you will see that it shows the following syntax:
visits{base(), 'Mean' mean(visits), 'Min' min(visits), 'Max' max(visits), 'stddev'
stddev(visits)} * gender
The highlighted section is the default axis expression for the numeric variable, which Survey Reporter has added automatically. To create a table containing the visits variable using the Table Syntax pane, you would need to add this axis expression, or create another axis expression containing the information you want to see.
For details of how to create valid axis expressions for different types of variable, see the Table Specification Syntax section.